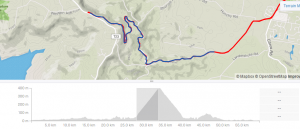
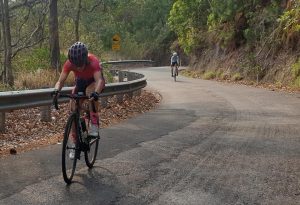
Today’s post is a file analysis that I didn’t need to get permission to share, because it is mine. I did a PB this morning for a popular climb we have here on the Sunshine Coast – Monty. It is a 6km climb at a lovely consistent 5% gradient that sweeps its way up into the hinterland town of Montville.
Strava tells me I have done this full climb more than 30 times since I moved to the Sunshine Coast last year. That is not including the number of times I have done sections of it as repetitions, because it is such a nice way to do intervals. We call these Montervals. So, in summary, I know the hill well. I often use it as a FTP test for myself and the athletes I coach, because the 6km length provides for about 20 minutes of work which is just about the right amount.

I did the ride with a pretty strong group of cyclists. It’s about 25km to get to the base of the climb, but they cruise out there, so it provides for a good warm-up. Last week I used the climb as a FTP test so I was happy to lead the group up there for the bulk of the distance (around 5kms of the 6kms). This week I decided that I was going to try and ‘take a wheel’ for as long as I could, to see how much difference that would make in terms of the elapsed time.
I’ve provided a graph of the ride in the picture. I have zoomed in on just the climb and have shown the lead into it and the end of it so you can see what happens to the metrics (19 minutes in total). Red is heart rate, pink is power, yellow is cadence and green is speed.

At the start of the climb I jumped on the wheel of two of the male riders as one was pacing the other up. A third male rider joined the group and then I sat on his wheel. There is a power surge at the start of the climb as the gradient is a bit steeper, plus this is where the group sorts itself out in terms of positioning. Then you can see the power settle into a nice rhythm. That is, until I popped. It’s pretty obvious where the elastic band popped, but just in case you can’t see the break point, I’ve marked it with the red arrow. At the time my feeling was that the lead guys accelerated a little bit (rather than me slowing down) and they confirmed this with me at coffee later. You can see I upped the power to try and stay with them, but that didn’t last long. At this point my heart rate was 173 which is about my threshold. So that really should not have been the issue. I just did not have the power to go with them. You can see from this point on that I drop my cadence and consequently my power drops. Remember, torque is what you apply to the pedals, but power is combination of force and rotational speed (i.e. – cadence).

I dug in for the second half without a wheel to follow, so the last 3km was done honestly. My heart rate continued to rise across this time, maxing out at 180bpm at the top. On a maximal climb, if you are really going for it, you expect to see cardiac drift. In other words – heart rate rises without a commensurate increase in power. It is an indicator that the athlete has made an honest effort, and depending on the amount of drift, could be close to maximal. Now clearly this is not something you want to see a lot of in a race, but for training and testing purposes it’s a sure sign of a good effort. My cardiac drift for the 19 minutes of the climb was 15%. I like it to be about 5-10%, so mine did not show good pacing. But that was no doubt due to the fact that I was trying to hang on to that darn wheel in front of me.
Let’s have a look at the summary data comparing the section of the climb before I popped with the section after I popped. The elastic band snapped just before half way, so it is 7 minutes versus 11 minutes. I’m just going to use raw power, as the difference between raw and normalized for the total climb was not large (217w v 223w).
|
Average power |
Average HR |
Cadence | |
| First 7 | 239 | 168 | 74 |
| Last 11 | 209 | 176 | 71 |
Now that’s a tale of two halves isn’t it? Interestingly, the peak 10 minute power at the beginning of the climb was higher than I did at the National championships in October on the first climb where I was trying to stay with the riders in the younger age category than me in order to set up my race (Masters 4 and 5 ride together at Nationals in the women).
Despite the decrement in the second half, the 20 minute power was my 3rd best ever in training or racing (AC – After Children, plus I never had a power meter BC). The two times I have beaten this were both on a hill with a much steeper gradient than this, and when I was 3kg heavier than I am now. So whilst the absolute power number was higher in the past, the power to weight ratio comparison is favourable now – 4.3w/kg compared to 4.1w/kg for the 20 minutes.
So, what are the take homes from this?
- Firstly, I was riding for a time today trying to beat my best time up. So my strategy was ‘grab a wheel and try and hang on’.
- I didn’t manage that, but the strategy allowed me to set the segment up well, and I wasn’t so burnt that I couldn’t do a reasonable second half to finish with.
- The pacing was therefore uneven, not what you would want if you were doing a FTP test.
- Consider what would happen if this was a race, and I needed to keep going after the climb to stay with a group. That presents an entirely different scenario. One very big match struck.
- If I wanted to improve on this time, I’d need to do some specific training to work on that back end.
- But then I would be training for a Strava segment, instead of to my goals (and weaknesses). Perhaps it would be worth a bit in terms of bragging rights, but I would always encourage you to focus on the bigger picture.
- Take the opportunities to do PBs up iconic climbs when they present, but don’t let these short term smiles distract you from your longer term goals.
- Oh, and I was 25 seconds faster than last week. Using the Strava segment compare functionality I can see that all of this was (not surprisingly) gained in the first half.
Happy riding

0 Comments