Here is a file share that we posted in our ‘coached athletes’ training group recently. It’s relevant to a wider audience so we decided to share it here.
For context, this file is from a very well trained endurance athlete (multiple masters national champion in a number of disciplines).
It demonstrates what COVID sequelae look like with regard to heart rate. One of the strange things about this condition, is that some days the athlete is OK, and some days you see this tachycardia (elevated heart rate). It’s not on every file or training day, but randomly appears.
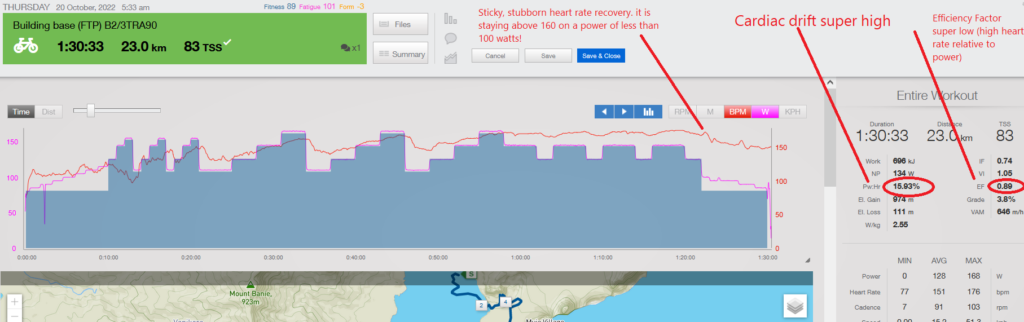
This workout is a reasonably modest trainer set of 90 mins. It has some 3 minute builds in it that top out at 90% of FTP. The overall intensity factor of the workout is 0.73. So the perceived effort for this should feel like ‘about a 7’. The athlete reports this felt like a 9 – which tells you something straight away.
The cardiac drift is exquisitely high. And in this instance, exquisite is not good! Cardiac drift can be complex, and always needs interpretation. Sometimes it can even be expected. But in this instance, that increase in heart rate relative to power across the workout is way too high for this athlete on this type of workout.
Additionally the efficiency is really low – meaning the heart rate is very high for the power output. In TrainingPeaks the EF that shows in the summary stands for Efficiency Factor. Now in real terms, this is not physiological efficiency. But TrainingPeaks have made it one of their proprietary terms and it has become widely used. It is the ratio of Normalized Power over average heart rate. So the higher, generally speaking, the better. Again, it is a sometimes complex interplay that requires interpretation. But for the most part, with training adaptation we should see an increase in this as stroke volume should increase (and heart rate decrease) for the same power.
The important thing with EF is to measure ‘like with like’ rides. For this reason you should separate out indoor and outdoor rides. The EF for these is often different because of the effect environmental conditions can have on heart rate. So if you are looking at the trend of EF across time, then have separate charts for indoor and outdoor rides. This is easy to do in WKO5 analytical software, which is what we use. We look at the 90 day trend in EF, and check for outliers. This ride, from this athlete, was a BIG outlier.
Finally, look how ‘sticky’ the heart rate is at the end. It’s holding at more than 160 beats per minute on less than 100 watts, which is below 50% of FTP for this rider. It just will not go down.
This is one of the reasons we always recommend you wear your heart rate monitor. Over time you can come to know and understand your physiology and look for outliers. Heart rate tells us so much. Unfortunately in this instance, we don’t know why we are seeing these random rides with a tachycardic response, although the suggestion is that COVID has resulted in myocarditis (inflammation of the heart muscle) at some point.
Questions or analysis? AMA here – or if you require deeper file analysis then book a consult with us.