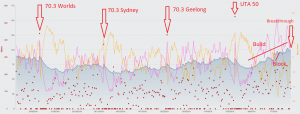
The performance management chart (PMC) in TrainingPeaks is a valuable tool you should look at regularly. It gives you a nice visual representation of your training, along with some key metrics. Here I’ve provided some analysis of the PMC of a triathlete over the past 12 months (with permission). To explain the lines and dots:
* the blue line is Chronic Training Load (CTL) – pretty self explanatory, a longer term measure of your training stress
* the pink line is Acute Training Load (ATL) – a short term indicator of training load
* the orange line is Training Stress Balance (TSB) or ‘Form’. It is an indicator of your readiness to race. You will notice that when ATL is high that your form is low. Makes sense – when you are in a big training block your legs would not look forward to racing.
* the red dots are the individual Training Stress Scores (TSS) of each day. All those red dots on the bottom of the graph indicate that the athlete did not train that day.
So to the interpretation:
* you’ll see I’ve put some red arrows to indicate the event the athlete was peaking for. 70.3 Worlds in South Africa last year, then 2 more 70.3 events in November and February
* this was followed by a trail running event in May known as the UTA. Now this athlete will be quick to tell you I don’t like this event at all. The physiological demands are not really compatible with half ironman racing, so I tolerate participation in this event, but do not endorse it!
* You can see a really high TSS red dot for the day for each of these 4 events. Not surprising.
* These TSS scores were 438, 375, 430 and a stupid high 536 for UTA. For what it’s worth, any day with a TSS higher than 300 is considered very high.
* After each of these events you can see a lovely drop in CTL as the athlete had at least a week of self selected light training
At the end of the graph you can see the current build through to the World 70.3 championships which are in Nice in September.
* you can see the athlete’s CTL is hovering around the 100 mark at the moment, which is the highest it has ever been
* I’ve marked the build with a red line, the athlete’s starting CTL was about 70
* I’ve also marked a week of block periodisation, where the athete came and trained with me on the Sunshine Coast for 5 days for a hill boot camp
* Over the 5 days the athlete’s CTL went from 81 to 98. This is well above what we would normally program (5-8 increase in CTL in a week). But heck, it was a boot camp and the athlete was there to work hard. Plus TrainingPeaks ‘rewards’ power based workouts that have lots of elevation with higher TSS scores than you can typically get on the flats.
And right at the end of the graph you can see the reason why I did this post. A breakthrough! The athlete does a hill session of repeats and records their highest ever 10 minute power on one of the reps. We often see these breakthroughs occur around 2 weeks after the block periodisation cycle. And this athlete provides a textbook perfect example of this.
Now the goal is to manage the training load of this athlete through the next 5 weeks to the Nice Worlds. Periodisation and peaking is kind of a little bit like channelling Goldilocks – training must be not too heavy, not too light, but just right.
