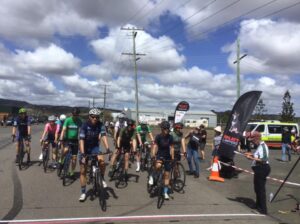
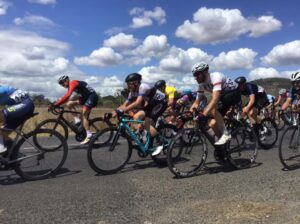
Handicap road racing is fast and furious by definition. Plus, it’s a heap of fun, if not a tiny bit painful. I find there is less pressure with handicap racing, as you are not really in control of the outcome. It is in the hands of the handicapper, so to speak; and the intent is that you work cooperatively with the group you are assigned. Usually, a group needs to work well together in order to try and stay away from chasing group/s. And if you are in a chasing group you also need to work hard. Ideally, rolling turns should start straight away, with all members of the bunch contributing. Of course, as riders we know this is not always our experience! A handicap race is constantly evolving as groups form and re-form. Therefore, the file analysis of these rides is always fascinating, at least to this data geek!
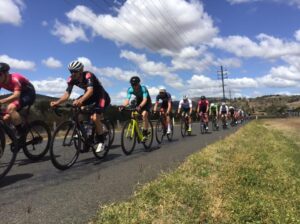
This past weekend, the largest handicap road race in Queensland took place in reasonable conditions. We are grateful to be able to race at the moment. For this race, I was able to compare seven training files from various athletes I coach. The file analyses closely match up with the athletes’ subjective comments about their race experience. I’ve included one chart from each athlete, plus some summary data.
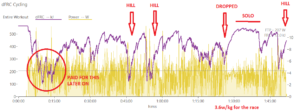
The particular chart I have chosen to use is an extract from the deep analysis tool that partners Training Peaks, WKO5. This chart is called “dynamic Functional Reserve Capacity” or as abbreviated, dFRC. Essentially, it is a modelled measure of an athlete’s anaerobic battery. In basic terms, it measures the capacity above your threshold and below your maximum power available. An athlete’s anaerobic battery is rechargeable and as you may have worked out from the name, it is dynamic – that is, it drains and can be replenished over the course of a race or training session.
On the chart, the dFRC is represented by a purple line and power (Y Axis) is yellow. In each chart, you can see the anaerobic battery draining and restoring across the ride as the athlete moves above and below their threshold. However, it is the pattern of the sustained hits that ultimately determines how the rider will perform in this handicap race. Consider a ‘hit’, one of the precious matches we have to burn. A strong “hit” is represented by a sharp dip in the dFRC purple line as shown below. As athletes we only have so many to work with. Use too many of them too soon and you may be in for a solo ride.
Whilst I have chosen to show you a power based chart, I should point out that for many athletes in handicap racing the ‘limiter’ can be heart rate. You tend to see very high heart rates because of the nature of the rolling turns. The lag in heart rate means it stays elevated for extended periods of time, and for some riders, the whole race.
Let’s look at these seven athlete files, I’ve added some annotations to the visual and some summary data below them. Remember, all seven athletes were in the same handicap race. The handicapper did a good job, as they all finished pretty much within five minutes of each other. To give some context, it was a 70km road race on mostly flat terrain (only 300m of elevation for the 70km). A small bunch of scratch riders got up for the win. Average speed for the winning scratch riders was 51.5km/hr and a new course record.
Rider 1
- This athlete took some big hits early on in the first 15 minutes
- Never really got back below threshold for any extended period of time
- Constantly taking hits after this, and was dropped with about 15km to go. Limped home.
- Normalized power for this was rider was exactly at their FTP. That is an Intensity Factor of 1.0 for 105 minutes. On paper, should not be possible. But there you go.
- Best ever average power for 90 minutes. Highest ever average heart rate for 90 minutes
- 3.6 W/kg for the race (the highest for the 7 athletes in this blog), but finished mid field
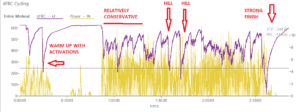
Rider 2
- Nice warm up from this rider with a couple of decent activations
- Relatively conservative first 30 minutes. Athlete was able to stay with the group without having to dig too deep
- Hills on the first lap didn’t really burn a match
- Second half of the race in large group. Continuous small hits but nothing too big
- Had capacity at the end to empty it in the sprint
- Second highest all-time 90 minute heart rate
- Intensity Factor was 0.91 on 2.8W/kg.
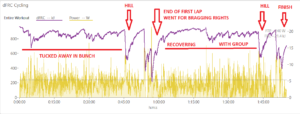
Rider 3
- This rider had the most conservative race, apart from the ‘prime’ chasing at the end of lap 1
- Safely tucked away in their bunch until the first hill with barely a match burned
- At the end of the first lap the rider went for bragging rights to be first across the line at halfway
- Then followed a nice period of recovery, before being absorbed by a larger group
- Rider chose not to join in with faster groups going past and rolled home
- Highest all-time 90 minute heart rate
- Intensity Factor was 0.89 on 2.9 W/kg
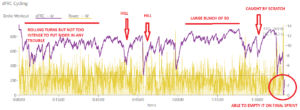
Rider 4
- This rider was in a strong group. Worked solidly in the group for the first 30 minutes taking rolling turns, but it was not enough to put the rider in trouble
- Small hits over the hills, but again not ‘matches’ that would have an effect
- Follows a long period in a very large group of 50 with heaps of time for the anaerobic battery to replenish
- Absolutely emptied the tank on the final sprint
- Highest ever 90 minute heart rate. 3rd highest all-time 90 minute power.
- Intensity Factor was 0.94 on 3.3W/kg
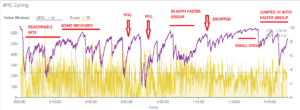
Rider 5
- This rider took some reasonable hits early on, but was able to sit in and recover
- Burnt a couple of matches on the hills on the first lap staying with their group
- Solid period in with a faster group with constant little hits eventually breaking the elastic band
- Small solo period before jumping on the back of a faster group to finish
- Intensity Factor was 0.89 on 2.7W/kg.
- Probably the most measured ride, cleverly working within capacity.
Rider 6
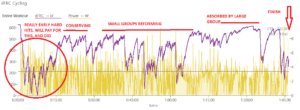
- For this rider I feel the matches burnt early were the issue. I’ve circled these really big hits for the first 15 minutes.
- After this the rider sat in behind the group in order to get their heart rate back under control. Sensible decision.
- A few smaller hits as faster groups come through and groups reform
- Rider was in the wrong position on an acceleration and the group was split
- Still something left in the tank to give the sprint at the end a kick
- Intensity Factor was 0.90 on 2.8W/kg.
Rider 7
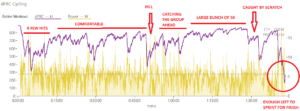
- This rider was in a strong group. A few early turns but the first 30 minutes were relatively comfortable
- Even the hills were absorbed pretty well with plenty left in the tank
- Long period of recovery in a large bunch of around 50 riders
- Check the burst required when the Scratch group came through and this rider tried to jump on
- Able to kick at the end for the final hill and sprint home
- Highest ever 90 minute heart rate, second highest ever 90 minute power
- Intensity Factor was 0.97 on 3.4W/kg.
Summary
dFRC is one of the charts I use the most in WKO5. The model of the so called ‘anaerobic battery’ is not perfect. However once you have a well populated power curve for your athlete it is a very useful chart to refer to. I think it’s a really interesting way to see how the same handicap race can play out differently for athletes based on the group they are in and how they approach the race.
The other interesting thing to note is how important pure power (absolute watts) is rather than relative power (W/kg) in a flat handicap race such as this. The smaller, lighter athletes were working much harder in relative terms to try and stay with their groups. But just like in flat time trialling, absolute power sometimes wins out.
I should also point out that dFRC can be used to measure the intensity of interval sessions for athletes, and to give them feedback about how the session was performed and whether they had any more to give. This is especially valuable if you are comparing the same session from week to week and you are looking for improvements (I’ll cover this in another blog post).
With thanks to the athletes who have given permission for their data to be used. Photo credits – Lifecycle Cycling Club.
