Many athletes in Australia are currently in lockdown. Of course the indoor trainer becomes your close ‘friend’ during these times. However, there is a limit to how much indoor training we want to do. Fortunately some of us are allowed to do outdoor rides solo or with one other rider, within a limited radius. For Victoria and NSW this has been 5km. In Queensland, most recently it was 10 km. And so it came to be in this last weekend gone, that many SDC athletes were set creative challenges for riding within their designated allowed area.
This file analysis is from a Brisbane based rider. He was allowed to ride in a 10km radius from his starting point. 10km is actually quite a large amount to work with. It would take you a couple of hours to cover this if you used the widest circumference. I know some clever person can do the math on that and work it out for me. I’m not going to. Trust me, it’s a decent amount of area to cover.
This athlete was given a 4 hour AMEX ride. What is an AMEX ride? It is a ride where you ‘don’t come home without it’. Those of you who are old enough will remember the Amex card ads where the buy line was ‘don’t leave home without it’. These rides are like that in reverse. Don’t come home without it. In this case, we are referring to the target TSS. Whatever the target TSS is, don’t come home without it. You’ll see that there is a time element to it as well. In this instance the ride title shows it ‘225 in 4’. That is 225 TSS in 4 hours. The time target is added because you could ride around all day at a low intensity and get the TSS. That is not the point. The point is to get the target TSS within the time frame. This way the ride is done at the desired intensity. In this instance that is an Intensity Factor of 0.75. This is challenging, but not over the top. Most hilly endurance rides would be done at this intensity or above by experienced riders.
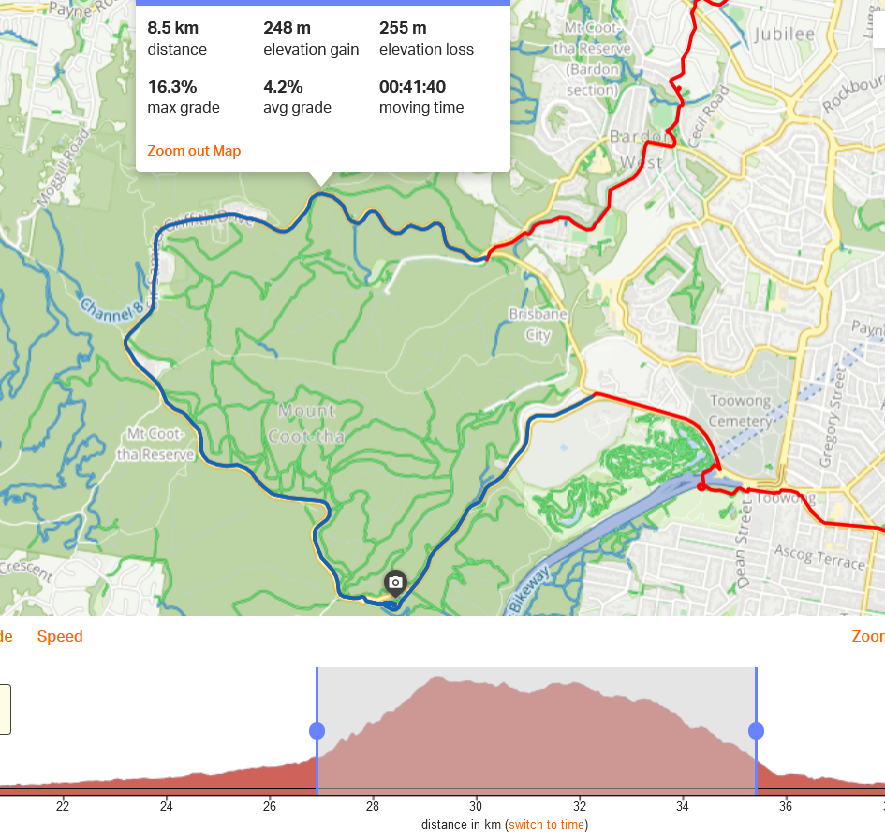
The rider decided he was going to do laps of Mt Coot-tha. This is an iconic climb in Brisbane, and the hill most riders there do, most often. Locals refer to the climb according to the direction they do it. The anti-clockwise direction is steeper and referred to as a Mt Coot-tha ‘back’. It is 2.1km at an average gradient of 9%. The full circuit is around 9km with 250m of elevation. Profile below.
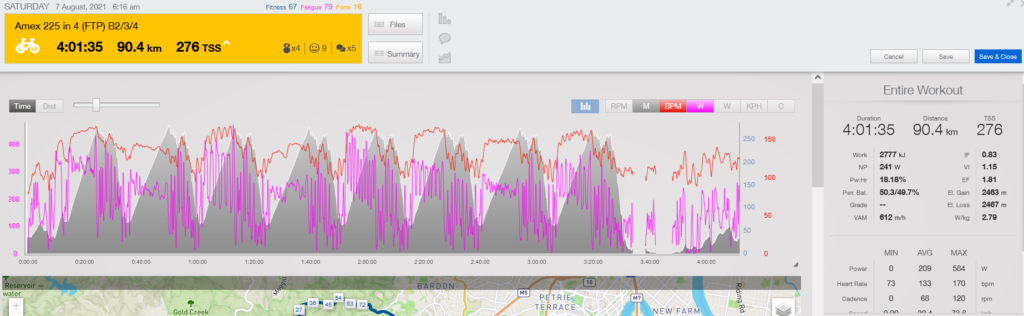
The target was 8 laps of Coot-tha, which is a very solid workout. That is 72km with 2000m of elevation, excluding warm up and cool down. Ahead of the ride I discussed the strategy with the rider and said ‘mix it up’. Try some seated, some standing, experiment and see how you go. Here is the ride. The grey background is the elevation profile, pink is power and red is heart rate. Summary ride data in the right box.
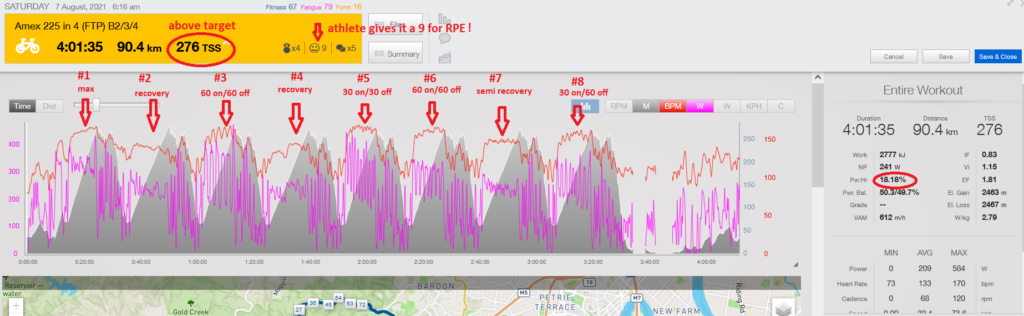
The next image annotates the ride to explain it more. You can see the rider got a TrainingPeaks amber. This is because they exceeded the target TSS of 225 in the 4 hours. TSS was 276 and that higher number was courtesy of the Intensity Factor being above the targeted 0.75. It was 0.83. And that’s a pretty solid number for a 4 hour ride. The rider gave this a 9 for RPE. Not sure what more was needed before this was a 10, but there you go.
Of interest is the high number for Pw:HR. I have circled it – more than 18%. This number is commonly referred to as ‘cardiac drift’. That is, an increase (or drift) upwards in heart rate across a session that is not accompanied by an increase in power. In this instance there is relatively little increase in heart rate across the ride. The so-called ‘decoupling’ is due to a reduction in power. And this is the result of fatigue. So this is therefore, NOT classic cardiac drift. This number ALWAYS needs to be interpreted in the context of the ride. Not all cardiac drift is created equal.
I’ve also annotated briefly how the rider executed each climb. A little more detail below:
#1 – pretty much a max effort. Rider got a PB for the loop, and he has done it more than 100 times.
#2 – recovery, mostly seated
#3 – 60 seconds on, 60 seconds off; with the ‘ons’ being 350W
#4 – recovery
#5 – 30 seconds on, 30 seconds off; with the ‘ons’ being 400W
#6 – 60 seconds on, 60 seconds off; with the ‘ons’ being 300W
#7 – semi recovery
#8 – 30 seconds on, 60 seconds off; with the ‘ons’ being 300W
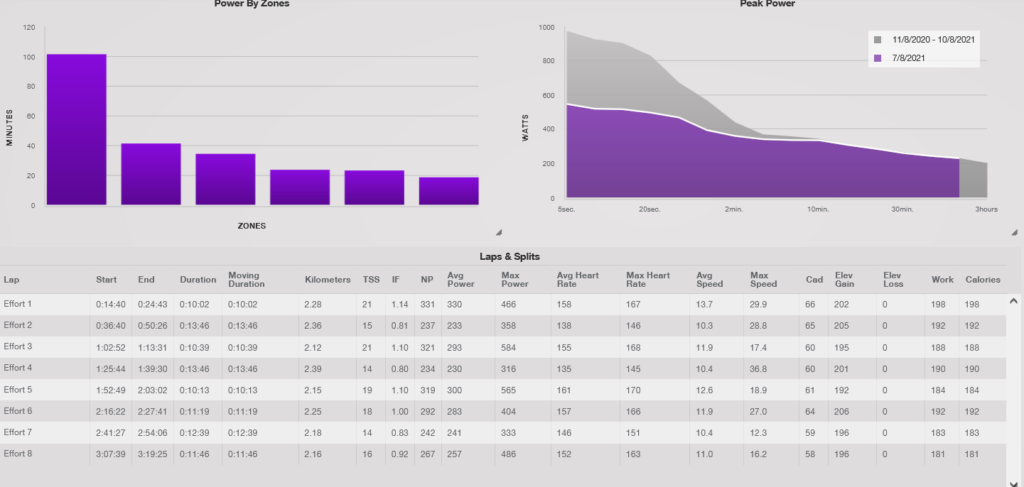
The next image below is the lap splits marked in TrainingPeaks. I’ve marked these manually on the file, eyeballing where the effort ended, hence the distances vary slightly. The zone distribution is also included for those interested. There was 64 minutes spent in Z4 or above.
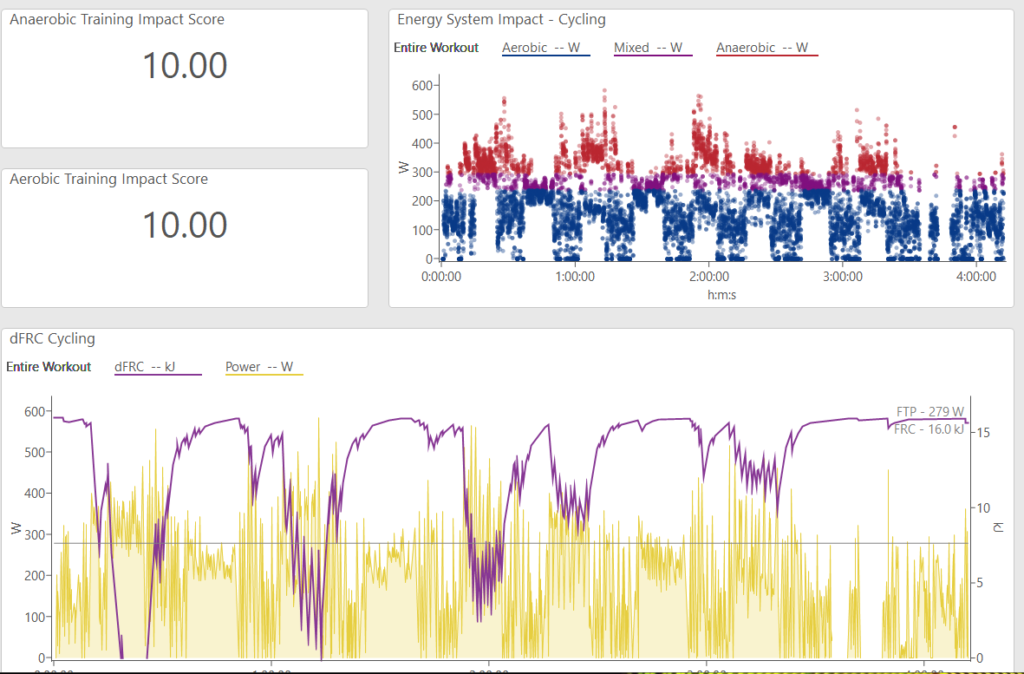
The final image is for those familiar with WKO and the dFRC chart. This essentially measures the anaerobic cost of the efforts. The purple line indicates where the athlete is draining their anaerobic battery on each effort. You can see on effort 1, it actually goes below zero. With a well modeled power curve this should not happen. In this instance the rider’s FTP is manually set to 291W. It is only modeling at 279W though, and I have marked this. The model can only use the data (that is the rides) that the athlete has done. This is why it is important that your power curve is ‘fresh’. In this instance the rider’s power curve has some ‘decay’ in it. Hence the reason they have been asked to do a 20 min max effort this week (you can read that as being requested to do a FTP test).
So what was the final outcome of this ride: all time power bests for 90 minutes, 60 minutes and 20 minutes. Second best ever 10 minute power. This is even more evidence that the power curve is modeling low. There is no way the rider should have been able to do this if the curve was modeling accurately. I’ll update this post once the rider has done their FTP test and let you know.
In the meantime, chapeau to MT – what a great training session!