The Tour de Brisbane is a Gran Fondo cycling event held over a 110km course with around 1300m of elevation. As a Gran Fondo event, the riders commence in groups starting 5 minutes apart. Most men started in 5 year age bands, whilst the women all started together in one band. As the race/ride progresses the group dynamics can affect riders as packs form and re-form across the course. Faster waves of riders come through that have started later, and engulf riders that started ahead of them. This format means that stronger riders in a group that started early have the potential to join a fast moving group that comes through from behind. This is particularly the case for female riders. As such ride files for female riders can look a little different to those of male riders, as shown below.
This is a selection of 5 ride files from the Tour de Brisbane on April 10th 2022. There are 2 graphs shown for each athlete. The top graph is the TrainingPeaks file showing heart rate and power, plus key summary metrics on the right. The bottom graph is the time matched dynamic Functional Reserve Capacity (dFRC) chart from WKO5 analytics software.
Essentially, dFRC is a modelled measure of an athlete’s anaerobic battery. In basic terms, it measures the capacity above your threshold and below your maximum power available. An athlete’s anaerobic battery is rechargeable and as you may have worked out from the name, it is dynamic – that is, it drains and can be replenished over the course of a race or training session.
On the chart, the dFRC is represented by a purple line and power (Y Axis) is yellow. In each chart, you can see the anaerobic battery draining and restoring across the ride as the athlete moves above and below their threshold. However, it is the pattern of the sustained hits that ultimately determines how the rider will perform in this ride/race. Consider a ‘hit’, one of the precious matches we have to burn. A strong “hit” is represented by a sharp dip in the dFRC purple line. As athletes we only have so many to work with. Use too many of them too soon and you may be in for a solo ride.
The other important metric I have provided is heart rate. Some suggest that once you purchase a power meter, that heart rate is limited in value. This is absolutely NOT true. Heart rate is a powerful metric to analyse. It provides great insights, and should always be considered when analysing a training file. For the Tour de Brisbane it could be a key limiter for some athletes, as there are long sections of relatively flat terrain on a motorway. Rolling turns in a group can produce high (and unsustainable) heart rates in some athletes.
Let’s look at these five files. I’ve annotated the visuals and provided summary data for each rider. A key term to understand is Intensity Factor (IF). That is; an IF of 1.0 is equivalent to FTP for that rider.
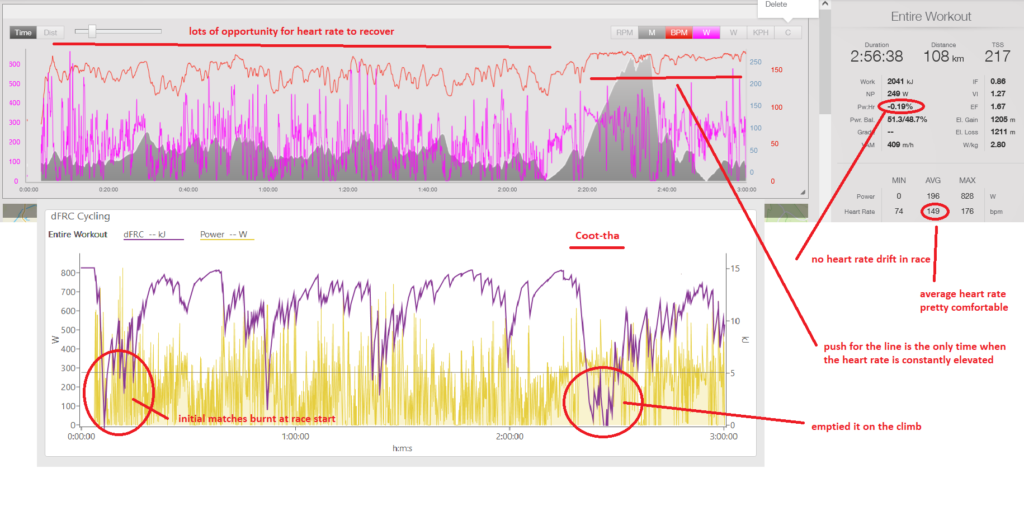
Rider 1
- Male, masters level, finished at the top of his category cohort
- The key factor is that the average heart rate for this rider was comfortable. The long section before the climb afforded him good opportunity to sit in the large pack he was in and conserve.
- This rider had virtually no cardiac drift in the race at all. That is, the heart rate did not increase relative to power. It indicates a well controlled race on his part.
- In terms of power there were some initial matches burnt when the race started in order to navigate through some tight street sections. They were tolerated well.
- Rider absolutely smashed the climb doing this at an intensity of 1.04 for 18 minutes!
- Pushed for home with his group for a well deserved top placing in his category.
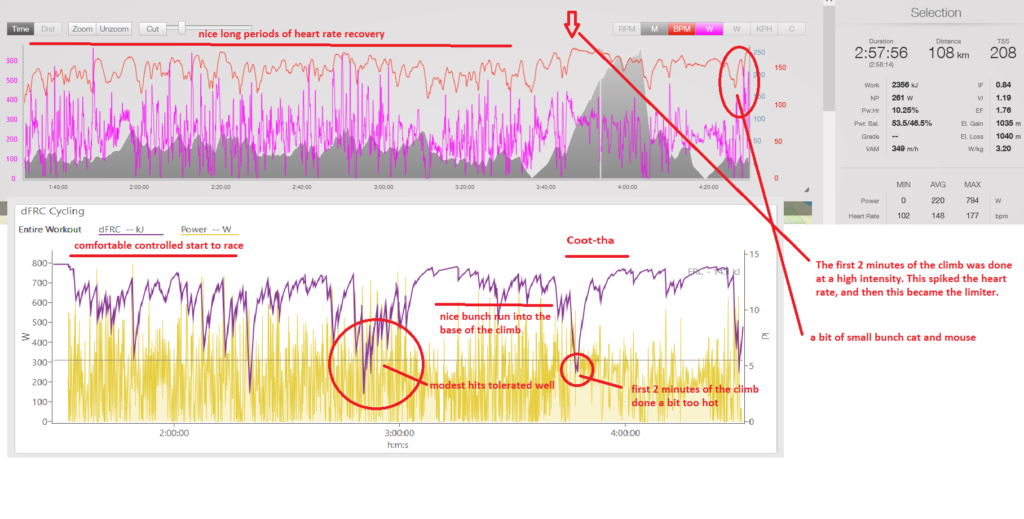
Rider 2
- Male, masters level, finished at the top of his category cohort
- This rider started in a different group to Rider 1 above, so the ride profile cannot be directly compared.
- The start of the ride was relatively conservative in terms of power. In the middle of the race there were some sustained hits that were tolerated well.
- A nice run into the base of the climb placed the rider in a good position.
- Rider had to respond to hard riding at the base of the climb in order to stay with the group he was with. This meant that the first 2 minutes of the climb was done at a very high intensity (1.22 IF).
- This spiked the heart rate, and this then became the limiter.
- Rider then had a light wheel clip requiring him to stop. In the process he lost the group he was with and spent the descent and the run into the finish not being able to rejoin them.
- A small section of cat and mouse ahead of the line can be seen at the end (yes he won this sprint).
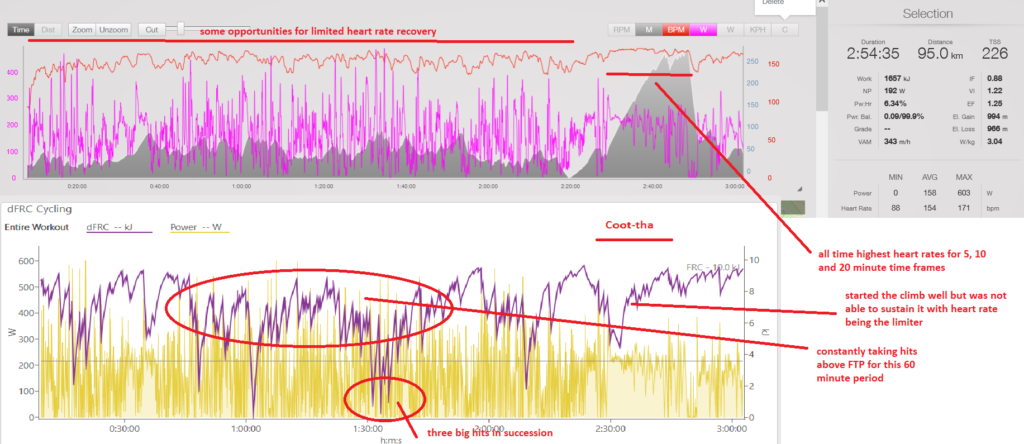
Rider 3
- Female, masters level, podium in her category
- For the females the race plays out differently. All females started together in one group. This meant the initial speed was slower than previous years for them when they had been with the equivalent male age group.
- You can see the point where the following group of 50-54 males joined them 30 minutes into the race. From this time on the rider was taking constant hits above FTP in order to try and stay with this group.
- A period of recovery followed into the base of the climb. The rider started the climb well but was not able to sustain it with heart rate being the limiter.
- All time highest heart rates for 5, 10 and 20 minute time frames
- Rider had done enough at this stage to secure her position. Was able to descend and ride strongly through to the finish line to take the win in her category.
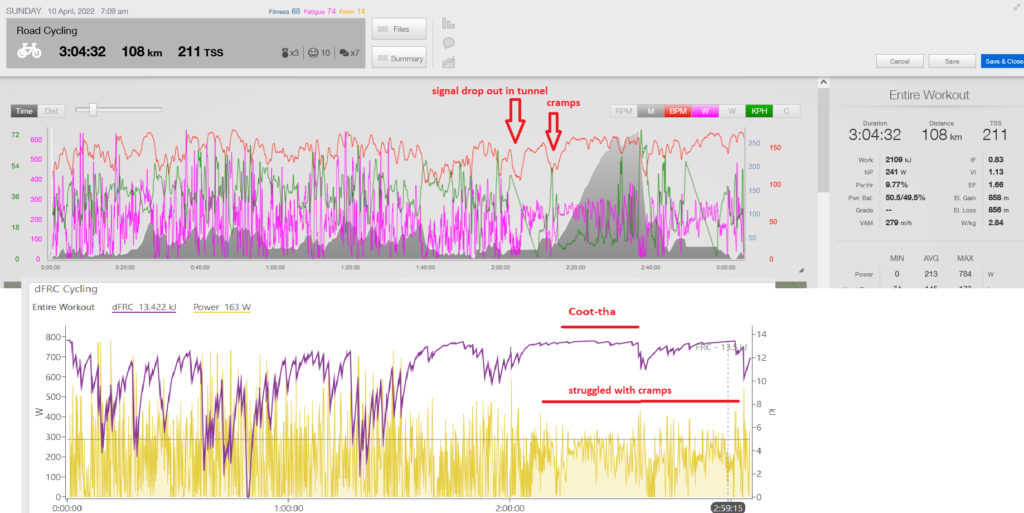
Rider 4
- Male, masters level, finished in first 10% of category
- This rider is a good example of how debilitating cramps can be when they occur
- You can see he burnt some matches, especially around the 50 minute mark. This was another period of this at the 80 minute mark.
- Around 2 hours and just before the start of the climb the cramps started. Some soft pedaling did not eliminate them completely. You know that feeling where they are twitching quietly in the background, ready to grip again if you should even think about putting any pressure on the pedal stroke.
- The rider backed off and did not quite limp up the climb, but was certainly not able to do it at the intensity he was capable of.
- Pickle juice did not eliminate the cramps. Hydration and electrolytes were not the issue. Unfortunately, some riders are pre-disposed to exertional cramps.
- Remainder of the rider was spent with a combination of soft and hard pedaling in order to get to the line.
Rider 5
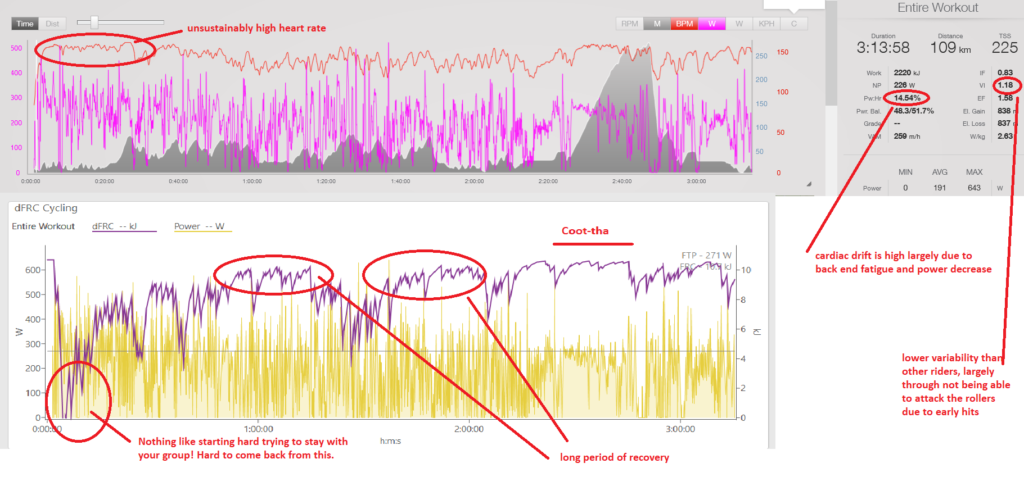
- Male, masters level. Historically an ultra endurance rider. Limited experience with mass participation Fondo events.
- This rider went out hard with his group! Observe the unsustainably high heart rate accompanied by a very big match burnt at the beginning of the race.
- His strategy was not to ‘die wondering’. And he didn’t, but was dropped from the group just before 30 minutes in.
- Following this there were long periods of solo/small group riding.
- High cardiac drift across the ride largely due to back end fatigue and a drop in power.
- This rider also had lower variability in his power profile across the ride. This was courtesy of not being able to attack the rollers, due to early hits that were hard to come back from.
Summary
These 5 ride files show how differently a ride can play out for different riders. Group dynamics play a large part in this. Granted these are difficult to control. But one thing you can control is to know and understand your own physiology. Be aware of what your strengths and limiters are. This will allow you to develop a race plan in line with your abilities.