As a sport scientist and coach I think the best way to demonstrate to athletes the value of a power meter is to use my own data and present the analysis of it. So here it is. It assumes a working knowledge of power and TrainingPeaks. This is not a quick read, so grab a coffee and give yourself a few minutes to digest it.
The Build
In terms of the build, let’s take it that I made the decision to race G2I at the beginning of the year and used my time at the Tour Down Under to launch my training. I went into TDU with a Chronic Training Load (CTL) of 91. Anyone that has ever been to TDU knows that you ride a lot that week. I did more than 700km and 8000m of elevation so at the end of the week my CTL was 110. Now clearly a ramp rate of 19 is well above what we normally recommend (5-8) in a week, but heck it’s TDU. My Training Stress Score (TSS) for the week was 1414; with one ride (the challenge event where you get to ride a stage of the tour) with a TSS over 300. This is relevant, as I consider 300 TSS to be the benchmark TSS I was chasing for the really long rides I wanted to do for G2I.
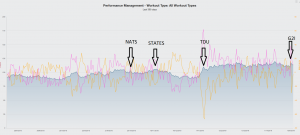
Returning from TDU I had a 16 week build leading into G2I. It looks like this on my performance management chart (PMC) for the past 12 months:
Background to the CTL
You can see the build through to the major goal of 2018 which was Masters Nationals in October. Then you can see the reduction in CTL after states as I went back into base training phase. I’ve marked the huge spike in CTL at TDU which launched the build to G2I. Key points:
- The starting CTL of 110 was an all-time historical high for me. By amateur cycling standards this is a very high starting CTL building to an event. It suggests I could have likely done the G2I back in January. I may not have enjoyed it much, but it was doable.
- The starting CTL of 110 was higher than the previous year’s peak of 105 leading into my major goal.
- This creates a challenge, where do you go from here? I was already in completely new territory, but I knew I had not trained properly for an event that was likely going to take me close to 8 hours to complete.
- I also knew that I needed to be doing 6-8 rides in that 300 TSS range. An endurance ride with moderate elevation (1000 metres over 100km) will typically give you a TSS in the range of 50-60 per hour. This meant I needed to be doing rides that lasted 6 hours and possibly more.
- Such rides create a logistical challenge for me. I simply can’t do them as my sons have weekend sport commitments. So I made the best of the situation. This meant that I would typically leave an hour earlier than my bunchie, I would continue to ride while my riding mates had their caffeine hit mid ride, and I would add whatever hills I could on at the end.
- In the first 6 weeks my weekly TSS ranged between 618 and 1036. My CTL went from 110 to 118. The long ride TSS scores were 220, 281, 266, 212, 191 and 301.
- I only hit my magical benchmark of TSS 300 for a ride once. Plus that’s a pretty modest ramp rate change of 8 across the 6 weeks. I missed very few sessions. But you can see there is not really a ‘build’ as such; because I started the program with a very high CTL. So quite a different approach compared to an athlete who may have come in from a low base.
- The next 6 weeks I raced a fair bit. I ‘trained through’ for nearly all these races, but you do take it a little easier the day before. Hence there was virtually no further change in my CTL. It went from 114 to 116. Weekly TSS ranged from 629 to 924. My long ride TSS scores actually dropped off a bit and were 220, 185, 276, 276, 200, 231 and 250.
- A typical week included 2 hill sessions each with around 1000m elevation in total. We don’t have any hills on the Sunny Coast longer than 6km. So one session would be done on this hill, and the other session was hill reps around the 6-8 minute mark. There would also be two bunch rides of around 60km. One of these was with the local A graders so for me was pretty intense. The long ride was normally on Saturday, up to 6 hours and 1500m elevation. On Sunday I would do another long ride of 3-4 hours, often with a crit in the middle of it.
- The final 2 weeks were where things went a bit pear shaped. I decided to race Anzac Day crits and the State crit champs. These were three days apart and meant I backed off my Saturday ride which was between them quite a bit (TSS – 160). Of course the physiology required to race crits is very different to that required for G2I. That’s OK, crits are good fun and I wanted to do them. It probably wasn’t the best preparation, but it was a lot of fun.
- I figured I still had one more weekend left before G2I. I like a reasonable amount of load in my legs going into a major event, so I had planned one final big ride. But I got the lurgy. Just a cold, but I missed a day’s training (which is unusual for me), and then had several days of just turning the legs over. So my last long ride went out the door. And that messed with my head. It meant I hadn’t done a really long ride for 2 weeks. I figured when I chose to race the crits I’d get away with missing one long ride, but I wasn’t anticipating getting sick and missing two. So it be; nothing you can do about it.
- You can see on the PMC below the drop in CTL in that 2 weeks going from 119 to 109 the day before the race.
- So I went into the race with exactly the same CTL as when I started the training after TDU. Have a look at the PMC for the 16 weeks below.
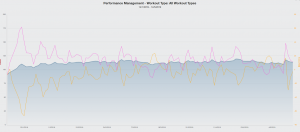
- Across the 16 weeks it was pretty much about maintenance, not build. I would have liked to have been able to do those really long weekend rides so that there was actually a build across 3-4 weeks, followed by a recovery week; with this 4-5 week cycle then being repeated twice. This would have left 2 weeks transition leading into the race.
- The result of this is I went into the race really quite anxious that I had not done enough work in that 180km plus range, but there was nothing I could do about it. I also thought I was a bit underdone, and that I had really peaked too early, about 6 weeks out, and then just tried to hang on to it.
- To summarise the 16 weeks: average distance per week was 399km, average number of hours per week was 14.6 and average elevation per week was 4119m.
The Race
First up here are the summary stats for the ride and then I’ll go through the ride analysis. My heart rate monitor was signalling incorrectly for the first 40 minutes. So the HR data I report excludes this time. My weight is 49kg and my FTP going into the race was 200W or 4.08w/kg for FTP calculated across 60 minutes.
-
Distance: 228km
-
Elevation: 3509m
-
Time: 8 hours 16
-
Intensity Factor (IF): 0.76
-
Average power: 118W
-
Normalized power: 152W
-
Variability Index: 1.29
The race started with a neutral 5km as we left Grafton. We then commenced 65km of rolling hills which would take us to the bottom of the main climb at Gibraltar range. This was the section that I underestimated a bit. There was 965m of climbing in this section of the ride, with virtually no flat sections. So whilst the pace was reasonably conservative, it was necessary to constantly dig in to stay with the bunch on the climbs. The 70km took 2 hours 15 with an IF of 0.79. The VI was 1.42 which indicates how ‘up and down’ the intensity was. The first QOM was at the 25km mark (Cattle Creek) and was 2km at 6%. This produced my highest 1 minute and 5 minute power for the ride at 233W with an IF of 1.16 or 4.7w/kg.
The main climb at Gibraltar starts at the 70km mark. The climb is 17km at 5.4%. As you read above, I had to change my plan for this section of the ride and was not able to ride it at the intensity I wanted to. I was with the first bunch at the base of the climb, but chose to back off and ride it at my own pace. It felt like I was riding it ‘tempo’, though as the stats indicate it was quite a bit more intense than it felt like. I did the climb in the high 50 minutes, but the stats below are for the 60 minutes as that is nice and neat:
- Average power: 180W
- Normalized power: 184W
- IF: 0.92
- VI: 1.02
- Cadence: 67
- Average HR: 173
- Pw:HR: 7.04%
So what does this mean? I rode the climb at 92% of my FTP (3.75w/kg), which is not tempo. If you like zones then it puts me at the bottom end of threshold. But if you consider that your FTP for an hour is just that, an hour; then 92% of this is pretty high. I’d burnt a match quite a few times in that first 70km so climbing for the hour at FTP was not realistic. The VI at 1.02 reflects very smooth riding; that 2% variation is simply due to the subtle changes in gradient across the climb. You can see there is 7% cardiac drift (or decoupling as some call it) across the climb. This is pretty normal for a climb of this length though, and does not represent a conditioning issue. Here is the visual representation of the data for the climb:
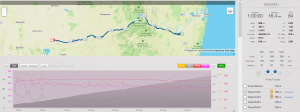
At the top of climb I was in ‘no man’s land’ between bunches, so I sat up and waited for the next small group to come through, which was not long. At this stage the cold cross-head winds had kicked in so it was pretty hard work. We tried to get the rolling turns to work but we had some passengers so it only worked well for small periods of time. There were also a couple of ‘race stops’ that the guys called and we had no choice but to go along with this and soft pedal a lot until the group reformed. So the stats from the 90km mark until the second feed station at 160km:
- Average power: 113W
- Normalized power: 135W
- IF: 0.68
- VI: 1.19
- Average HR: 146
You can see from this just how conservatively I rode this section of the ride. I didn’t really have an alternative as it was too windy to go out on my own. But I look at this data and I am kind of a bit surprised and a tad annoyed with myself that I got myself into this situation.
The final section of the analysis is from the second feed station at 160km to the finish at 228km. As I indicated in my race report above I came good at about the 185km mark and felt the best I had for the last 40km of the race.
- Average power: 102W
- Normalized power: 142W
- IF: 0.71
- VI: 1.39
- Average HR: 134
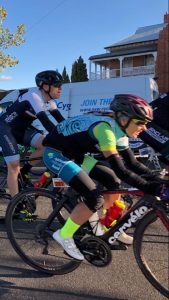
There is a pretty big net downhill for this section of the ride (almost 500m), hence the low average heart rate, but high VI. There was a sprint for the finish so highest power for 30 seconds was recorded at the finish at 348W or 7.1 w/kg. No-one wants to have to sprint at the end of 228km but it has to be done and produces a pretty good pain face photo!
Summary
I feel the key points with my ride are around the intensity I did the main climb at, and whether that afforded me a degree of protection for the rest of the race courtesy of the bunch I ended up with. I think it did and I reckon the numbers support this. I did not have any nutrition issues at all. This might have been completely different if my intensity had been higher in that middle section of the race. There is also some consideration around the intensity of the climb relative to FTP. Some Strava stalking on my part indicates that others have done this typically between 90 and 95% of FTP. So your capacity to ride the climb at a higher intensity of your FTP, and not have this effect you later in the race was a key issue. Looking at others I can also see they have worked much harder than me in that section of the ride from 90-160km.
The other point of note is that my feeling going into the race that I was underdone in that 180km plus training range did not eventuate. This final 40km of the ride was when I felt the strongest. However, again, this may have not been the case if I had ridden the middle section at higher intensity.
I guess there is really only one way to find out, and that’s to come back and do the race again! I hope you’ve enjoyed the analysis and shoot me through any questions you have.
0 Comments